Watershed Model Data
The Watershed Model Data window shows watershed model data including land use, and groundwater pumping and recharge estimated with the watershed model CropSim.
- Data zonation area
Show Zonesactivate a new window displaying the distribution map of the selected output zones (See Zone Plot Window).Load Resultsload the results from the model files and calculate the pumping, recharge and land cover area for each output zone. It can take a while and the program will be frozen during the reading process.
- Selection area provide the filtering function on the data. Users can select specific variable, zone, crop type and irrigation type for plotting or export. In each selection block, one or more items can be selected. To select multiple items, press the Ctrl when clicking the items or check the boxes. If no item is selected when plotting, the program assumes that all the items are selected (no filtering).
Variables Selection Blockprovide the option of variables to be plotted or exported. Currently, user can select annual groundwater pumping, groundwater recharge or/and land use acres.Zones Selection Blockprovide the option of zones to be plotted or exported. The items provided in this block will change when the output zone is changed.Crops Selection Blockprovide the option of crop types to be plotted or exported. The items in this block depends on the crop types used in the waterhsed model and usually include corn, pasture (past), sugar beets, edible beans, alfalfa, winter wheat and soybean.Irrigation Selection Blockselection block provides the option of irrigation types to be plotted or exported. There are four irrigation types including dryland (no irrigation), groundwater irrigated, surface water irrigated and commingle irrigated.
- Plot control area include controls to customize the plots.
Plot typecontrol if the data are plotted as lines, bars or areas.Stacked Checkboxstack the bar and area plots. Note that the bar and area plots will be stacked based on all other dimensions except the time.Cumulative Checkboxplot the cumulative values instead of the annual values.Sum Zones Checkboxsum the values based on zones. For example, if the user want to plot the total pumping in Box Butte and Cherry counties, the user can select Groundwater pumping and these two counties for data, and check thisAgg.Zonescheckbox.Sum Crops Checkboxis similar toSum Zonesbut it sums over crop types instead of zones.Sum IrrTypes Checkboxis similar toSum Zonesbut it sums over irrigation types instead of zones.xAxis Labelmake change to the title of the x-axis of the plot.yAxis Labelmake change to the title of the y-axis of the plot.Plot Titlemake change to the plot title.Plotmake the plot based on the selected data and options.Export Dataexport the plotting data as a spreadsheet. Note that the plotting data can saved only after they are plotted.
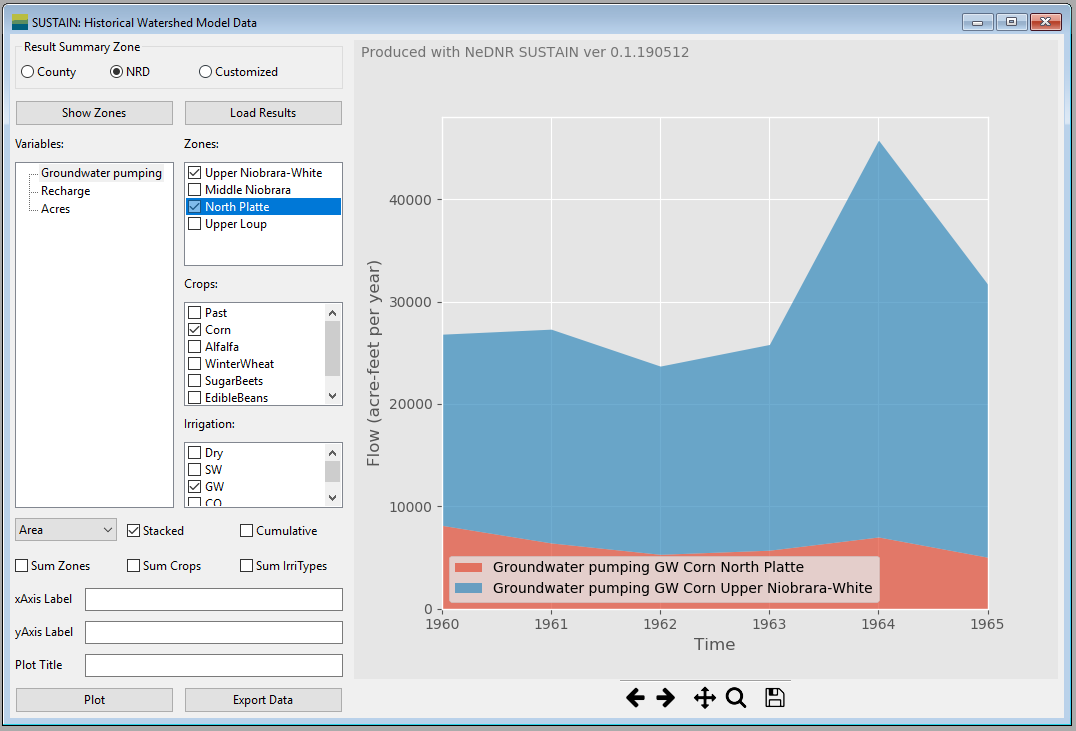
- Plotting area is on the right of the window. It includes the plotting figure and the navigation tool bar.
Plotting figureoccupy the most plotting area. When user resize the window, the size of the plotting figure will change accordingly.Navigation tool barat the bottom of the plotting area control the view of the figure. The detailed usage of each button can be found on this page: https://matplotlib.org/users/navigation_toolbar.html.