Groundwater Budget
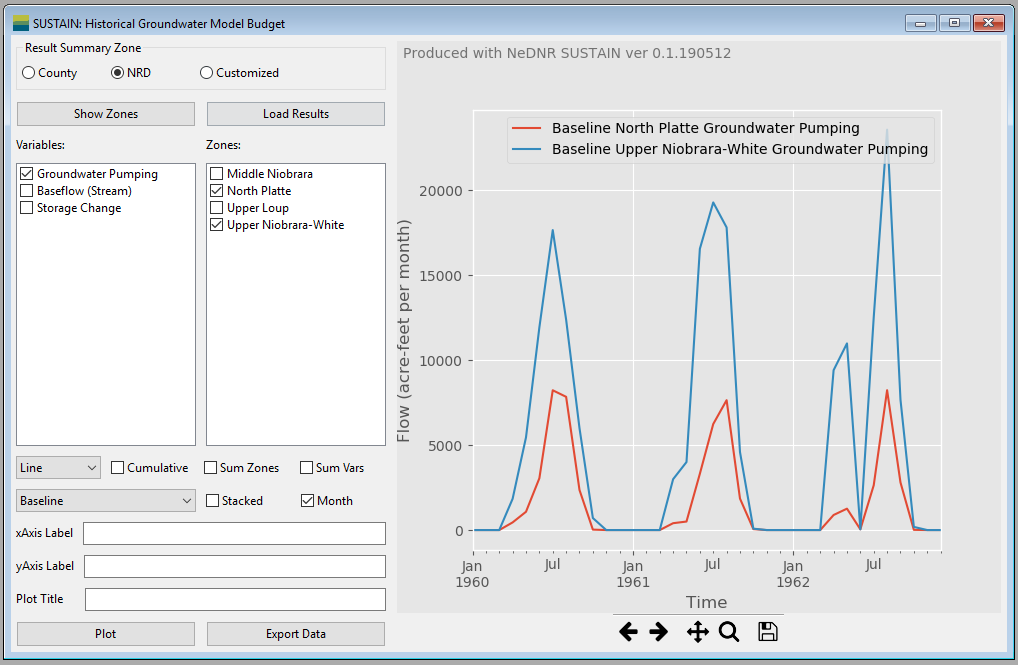
The Groundwater Budget window is similar to the Watershed Model Data window. But it shows groundwater flow data including groundwater pumping, baseflow and groundwater storage change estimated with the MODFLOW groundwater model.
- Data zonation area select the spatial division of the data to be plotted.
For example, if the NRD option is selected, the model results are aggregated in each NRD. The customized zone allows users select an existing zone file or shapefiles to define the output zone. Please see Create a customized zone.
Show Zonesactivate a new window displaying the distribution map of the selected output zones (See Zone Plot Window).Load Resultsload the results from the model output file and calculate the pumping, baseflow and groundwaer storage change for each output zone. It can take a while and the program will be frozen during the reading process.
Selection area provide the filtering function on the data. Users can select specific variables and zones plotting or export. In each selection block, one or more items can be selected. To select multiple items, press the Ctrl when clicking the items or check the boxes. If no item is selected when plotting, the program assumes that all the items are selected (no filtering).
Variables Selection Blockprovide the option of variables to be plotted or exported. Currently, user can select groundwater pumping, baseflow or/and groundwater storage change.Zones Selection Blockprovide the option of zones to be plotted or exported. The items provided in this block will change when the output zone is changed.
Plot control area include controls to customize the plots.
Plot typecontrol if the data are plotted as lines, bars or areas.Cumulative Checkboxplot the cumulative values instead of the annual values.Sum Zones Checkboxaggregate the values based on zones. For example, if the user want to plot the total pumping in Box Butte and Cherry counties, the user can select Groundwater pumping and these two counties for data, and check thisSum Zonescheckbox.Sum Vars Checkboxis similar toSum Zonesbut it sums up the selected variables. For example, users want to understand the total increased water availability after retiring irrigation. They can look at the sum of increased baseflow and groundwater storage by selecting these variables and this option.Result typecontrol which data to be used to plot. It includes the baseline data, scenario data and the difference between the baseline and scenario.Stacked Checkboxstack the bar and area plots. Note that the bar and area plots will be stacked based on all other dimensions except the time.Month Checkboxplot the data on monthly basis instead of annual.xAxis Labelmake change to the title of the x-axis of the plot.yAxis Labelmake change to the title of the y-axis of the plot.Plot Titlemake change to the plot title.Plotmake the plot based on the selected data and options.Export Dataexport the plotting data as a spreadsheet. Note that the plotting data can saved only after they are plotted.
Plotting area is on the right of the window. It includes the plotting figure and the navigation tool bar. -
Plotting figureoccupy the most plotting area. When user resize the window, the size of the plotting figure will change accordingly. -Navigation tool barat the bottom of the plotting area control the view of the figure. The detailed usage of each button can be found on this page: https://matplotlib.org/users/navigation_toolbar.html.